实现matplotlib图形通过PyQt5+Qt5在GUI中呈现步骤:
第一步,通过matplotlib.backends.backend_qt5agg类来连接PyQt5:
import matplotlib
matplotlib.use("Qt5Agg")  # 声明使用QT5
from matplotlib.backends.backend_qt5agg import FigureCanvasQTAgg as FigureCanvas
from matplotlib.figure import Figure
from PyQt5 import QtWidgets,QtCore
from PyQt5.QtWidgets import QMainWindow,QApplication
import sys
第二步,具体图形代码实现部分,例:
class Figure_Canvas(FigureCanvas): # 通过继承FigureCanvas类,使得该类既是一个PyQt5的Qwidget,又是一个matplotlib的FigureCanvas,这是连接pyqt5与matplot lib的关键
def __init__(self, parent=None, width=11, height=5, dpi=100):
fig = Figure(figsize=(width, height), dpi=100) # 创建一个Figure,注意:该Figure为matplotlib下的figure,不是matplotlib.pyplot下面的figure
FigureCanvas.__init__(self, fig) # 初始化父类
self.setParent(parent)
self.axes = fig.add_subplot(111) # 调用figure下面的add_subplot方法,类似于matplotlib.pyplot下面的subplot方法
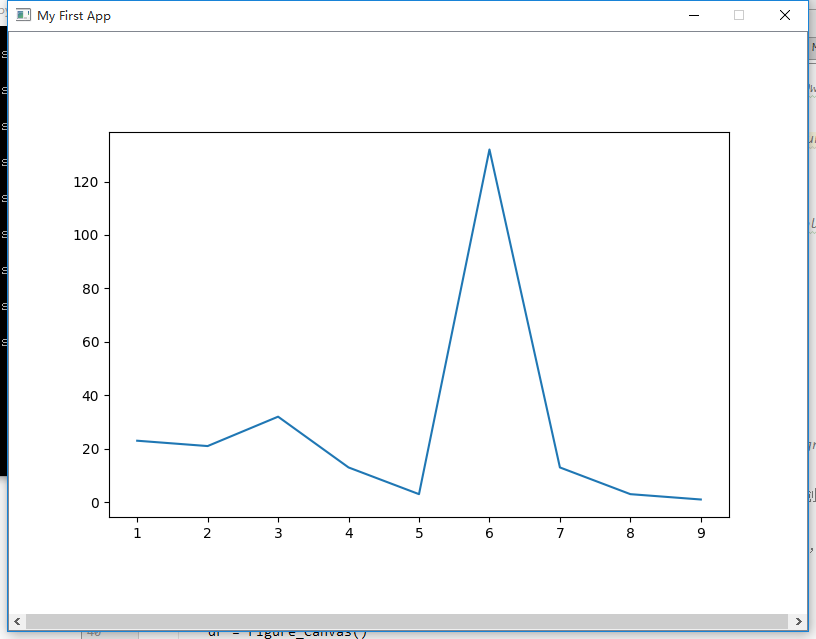
def test(self):
x = [1,2,3,4,5,6,7,8,9]
y = [23,21,32,13,3,132,13,3,1]
self.axes.plot(x, y)
第三步,GUI上通过控件呈现matplotlib画出来的图形——通过QtWidgets.QGraphicsView控件来实现:
class Mytest(QMainWindow):
    def __init__(self, *args, **kwargs):
        super().__init__(*args, **kwargs)
        # 设置窗口标题
        self.setWindowTitle('My First App')
        self.setFixedSize(800, 600)

        # ===通过graphicview来显示图形
        self.graphicview = QtWidgets.QGraphicsView()  # 第一步,创建一个QGraphicsView
        self.graphicview.setObjectName("graphicview")

        dr = Figure_Canvas()
        #实例化一个FigureCanvas
        dr.test()  # 画图
        graphicscene = QtWidgets.QGraphicsScene()  # 第三步,创建一个QGraphicsScene,因为加载的图形(FigureCanvas)不能直接放到graphicview控件中,必须先放到graphicScene,然后再把graphicscene放到graphicview中
        graphicscene.addWidget(dr)  # 第四步,把图形放到QGraphicsScene中,注意:图形是作为一个QWidget放到QGraphicsScene中的
        self.graphicview.setScene(graphicscene)  # 第五步,把QGraphicsScene放入QGraphicsView
        self.graphicview.show()  # 最后,调用show方法呈现图形!Voila!!
        self.setCentralWidget(self.graphicview)
        self.graphicview.setFixedSize(800,600)

if __name__ == '__main__':
    app = QApplication(sys.argv)
    mytest=Mytest()

    mytest.show()
    app.exec_()
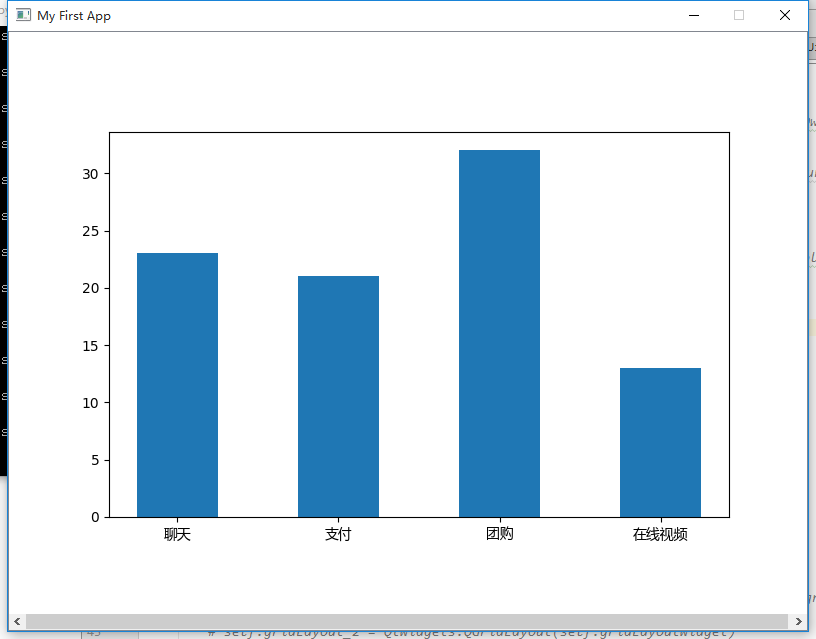
柱状图实现
#-*- coding: utf-8 -*-
import matplotlib
matplotlib.use("Qt5Agg")  # 声明使用QT5
from matplotlib.backends.backend_qt5agg import FigureCanvasQTAgg as FigureCanvas
from matplotlib.figure import Figure
from PyQt5 import QtWidgets,QtCore
from PyQt5.QtWidgets import QMainWindow,QApplication
import numpy as np
import sys
import matplotlib.font_manager as fm
myfont = fm.FontProperties(fname='C:/Windows/Fonts/msyh.ttc')

class Figure_Canvas(FigureCanvas):   # 通过继承FigureCanvas类,使得该类既是一个PyQt5的Qwidget,又是一个matplotlib的FigureCanvas,这是连接pyqt5与matplot                                          lib的关键

    def __init__(self, parent=None, width=8, height=5, dpi=100):
        fig = Figure(figsize=(width, height), dpi=100)  # 创建一个Figure,注意:该Figure为matplotlib下的figure,不是matplotlib.pyplot下面的figure

        FigureCanvas.__init__(self, fig) # 初始化父类
        self.setParent(parent)

        self.axes = fig.add_subplot(111) # 调用figure下面的add_subplot方法,类似于matplotlib.pyplot下面的subplot方法

    def test(self):
        #x = ['第1周','第2周',3,4,5,6,7,8,9]
        x = ['聊天', '支付', '团购', '在线视频']
        idx = np.arange(len(x))
        y=[23,21,32,13]
        width = 0.5
        #y = [23,21,32,13,3,132,13,3,1]
        self.axes.bar([0,1,2,3],y,width,align="center")
        self.axes.set_xticks([0,1,2,3])
        self.axes.set_xticklabels(x,fontproperties=myfont)

class Mytest(QMainWindow):
    def __init__(self, *args, **kwargs):
        super().__init__(*args, **kwargs)
        # 设置窗口标题
        self.setWindowTitle('My First App')
        self.setFixedSize(800, 600)

        # ===通过graphicview来显示图形
        self.graphicview = QtWidgets.QGraphicsView()  # 第一步,创建一个QGraphicsView
        self.graphicview.setObjectName("graphicview")
        # self.gridLayout_2.addWidget(self.graphicview, 0, 0)
        #第二步,将该QGraphicsView放入Layout中

        dr = Figure_Canvas()
        #实例化一个FigureCanvas
        dr.test()  # 画图
        graphicscene = QtWidgets.QGraphicsScene()  # 第三步,创建一个QGraphicsScene,因为加载的图形(FigureCanvas)不能直接放到graphicview控件中,必须先放到graphicScene,然后再把graphicscene放到graphicview中
        graphicscene.addWidget(dr)  # 第四步,把图形放到QGraphicsScene中,注意:图形是作为一个QWidget放到QGraphicsScene中的
        self.graphicview.setScene(graphicscene)  # 第五步,把QGraphicsScene放入QGraphicsView
        self.graphicview.show()  # 最后,调用show方法呈现图形!Voila!!
        self.setCentralWidget(self.graphicview)
        #self.graphicview.setFixedSize(800,600)

if __name__ == '__main__':
    app = QApplication(sys.argv)
    mytest=Mytest()

    mytest.show()
    app.exec_()